Color ramp (ColorRampCollection) 
A color ramp is a color gradient defined over a specific interval (such as [0, 1]) where any value within the range maps to a color. Ramps are defined by at least one color at each boundary, usually with additional colors within the range.
Color ramps are useful for representing numerical data visually, such as temperature, population density, or average commute times.
Example
import { ColorRampCollection } from "@maptiler/sdk";

// Use the built-in TURBO color ramp
const turbo = ColorRampCollection.TURBO;
To access values from an existing color ramp:
import { ColorRampCollection } from "@maptiler/sdk";

// Rescale the built-in TURBO color ramp from [0, 1] to [-18, 38]°C
const temperatureTurbo = ColorRampCollection.TURBO.scale(-18, 38);

// Get the color array at 0°C (returns [45, 218, 189, 255])
const zeroColor = temperatureTurbo.getColor(0);

// Get the color hex string at 0°C (returns "#2ddabdff")
const zeroColorHex = temperatureTurbo.getColorHex(0);
To create a custom color ramp, define the colors for each color stop. The values can match your dataset’s range and do not need to be normalized to [0, 1]. For example, this recreates a Viridis color ramp with a range going from 0 to 100:
import { ColorRamp } from "@maptiler/sdk";

const myCustomRamp = new ColorRamp({
  stops: [
    { value: 0, color: [68, 1, 84] },
    { value: 13, color: [71, 44, 122] },
    { value: 25, color: [59, 81, 139] },
    { value: 38, color: [44, 113, 142] },
    { value: 5, color: [33, 144, 141] },
    { value: 63, color: [39, 173, 129] },
    { value: 75, color: [92, 200, 99] },
    { value: 88, color: [170, 220, 50] },
    { value: 100, color: [253, 231, 37] },
  ]
});
When defining a custom ramp, colors can be specified as RGB arrays [r, g, b] or RGBA arrays [r, g, b, a].
Non-linear color ramps
In this section we will see how to use the resample function of a color ramp to improve the visualization of data from a point layer.
We are using a large dataset containing all the public schools in the US. We are using the PORTLAND color ramp:
For the purpose of visualizing the number of students, we are going to scale the PORTLAND color ramp on the range 300 to 4000 as most schools will contain more than 300 students and less than 4000.
Linear
We used the following color ramp definition:
import { ColorRampCollection } from "@maptiler/sdk";

const ramp = ColorRampCollection.PORTLAND.scale(300, 4000);
Here is how the data looks over New York City:
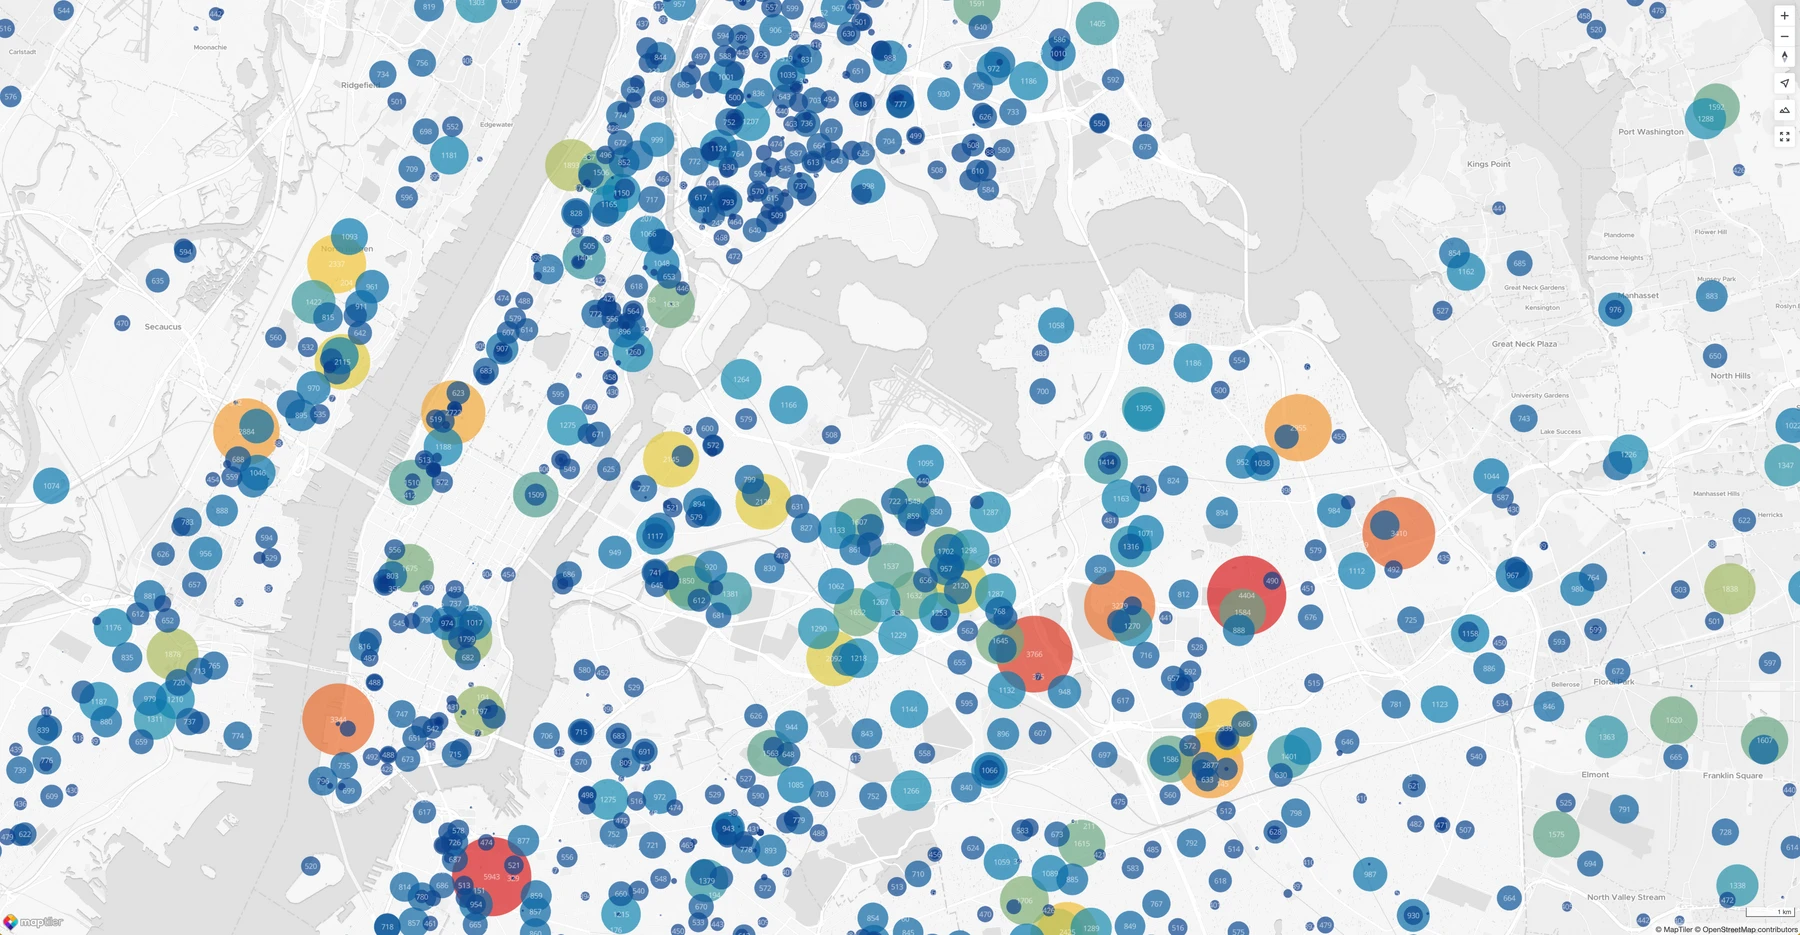
It’s not entirely bad, but only the very large schools stand out and it is difficult, without looking at the numbers, to differentiate the blue dots from their color variations.
Generally speaking in data visualization, small variations matter towards the lower bound and large variations matter towards the upper bound. For this particular dataset, we want a school with 300 students to show differently from a school with 500 (in other words, a small difference of 200 in the lower bound), but we want a school with 3800 students to look roughly the same as one with 4000 students (in other words, a small difference on the upper bound). This is where non-linear rescaling of color ramps comes into play.
Non-linear: ease-out square-root
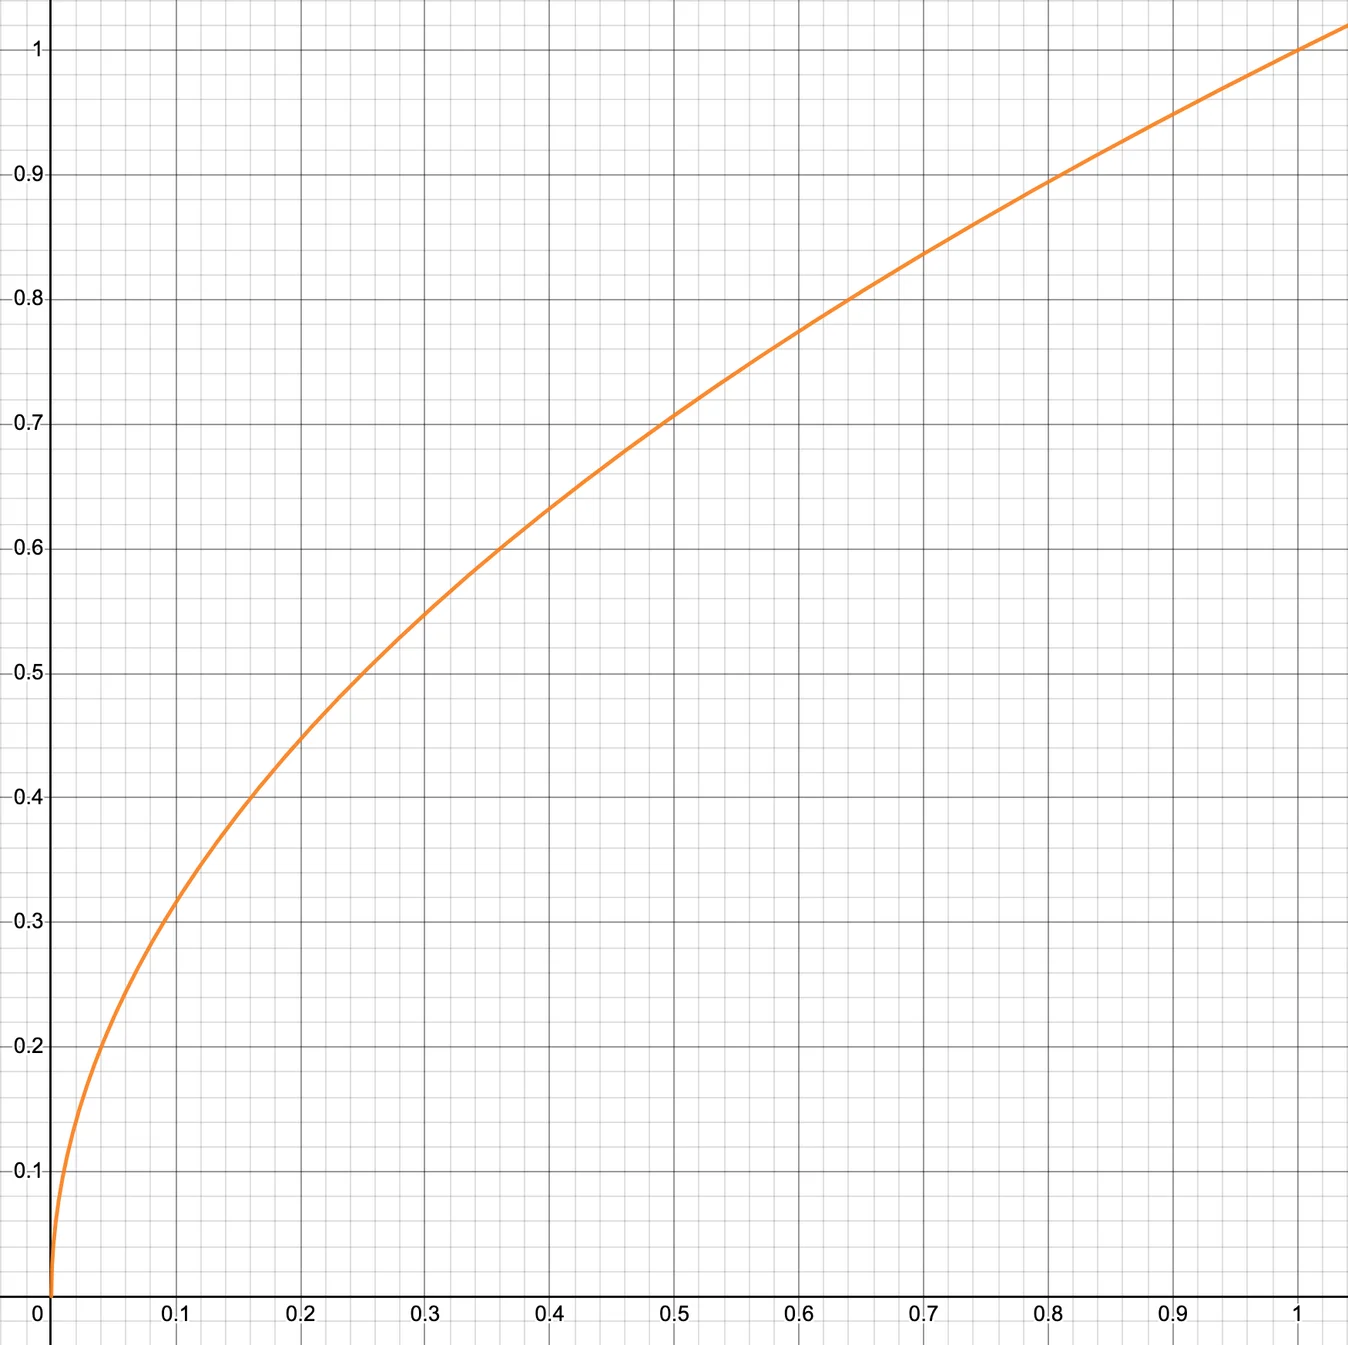
Easing-out means that something accelerates a lot at the beginning of an interval and slows down towards the end, while still monotonically increasing.
To perform the non-linear rescaling of color ramps, MapTiler SDK performs intermediate range changes so that only the range [0, 1] is observed (and then rescaled to its original range). Here is how the square root function looks, naturally behaving as an ease-out function:
To obtain a PORTLAND color ramp scaled with the square root method:
import { ColorRampCollection } from "@maptiler/sdk";

const ramp = ColorRampCollection.PORTLAND.scale(300, 4000).resample("ease-out-sqrt");
This results in the following version of PORTLAND:
As we can see compared with its linear version, this resampled color ramp is slightly left-skewed and shows much faster variations towards the beginning of the range. That is exactly what we want to leverage to better visualize the differences between schools with fewer students.
Here is how the same data looks now:
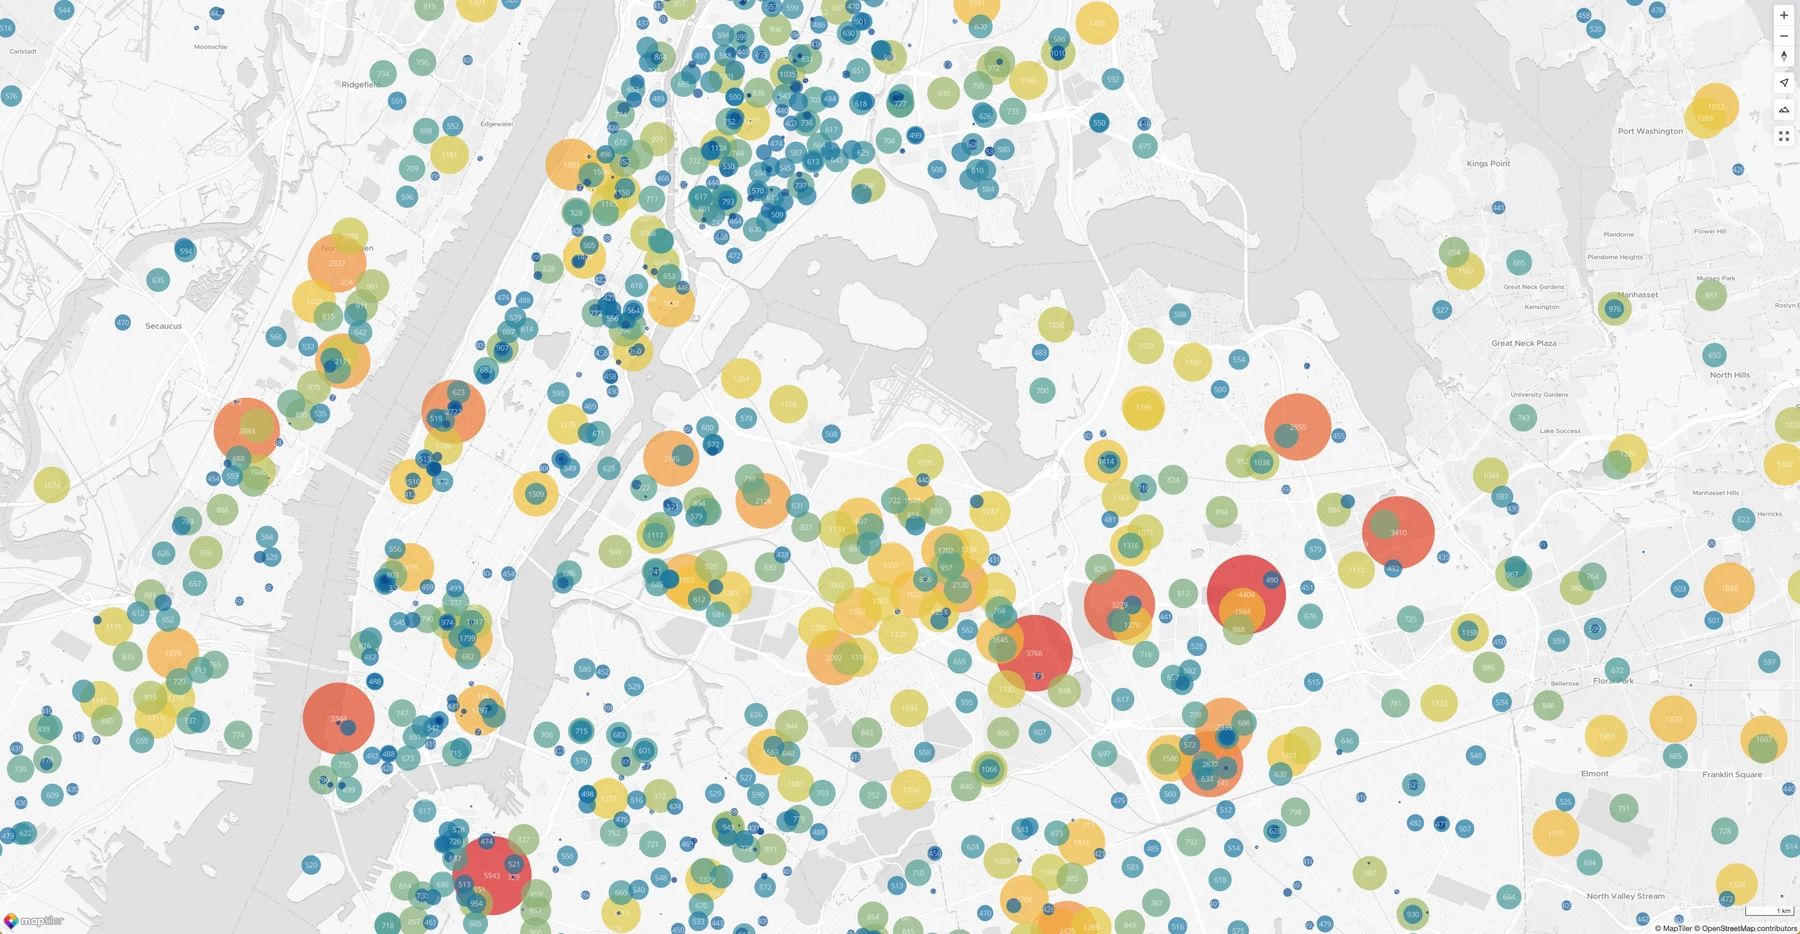
We can now easily differentiate a school with 400 students from one with 800.
Non-linear going too far: ease-out exponential
Some functions have a much steeper slope than the square root function and emphasize the differences even more on the lower bound—perhaps too much, at the expense of clarity for the rest of the range.
For very specific use cases, the SDK features an exponential resampling. Here is how its function looks on the [0, 1] range:
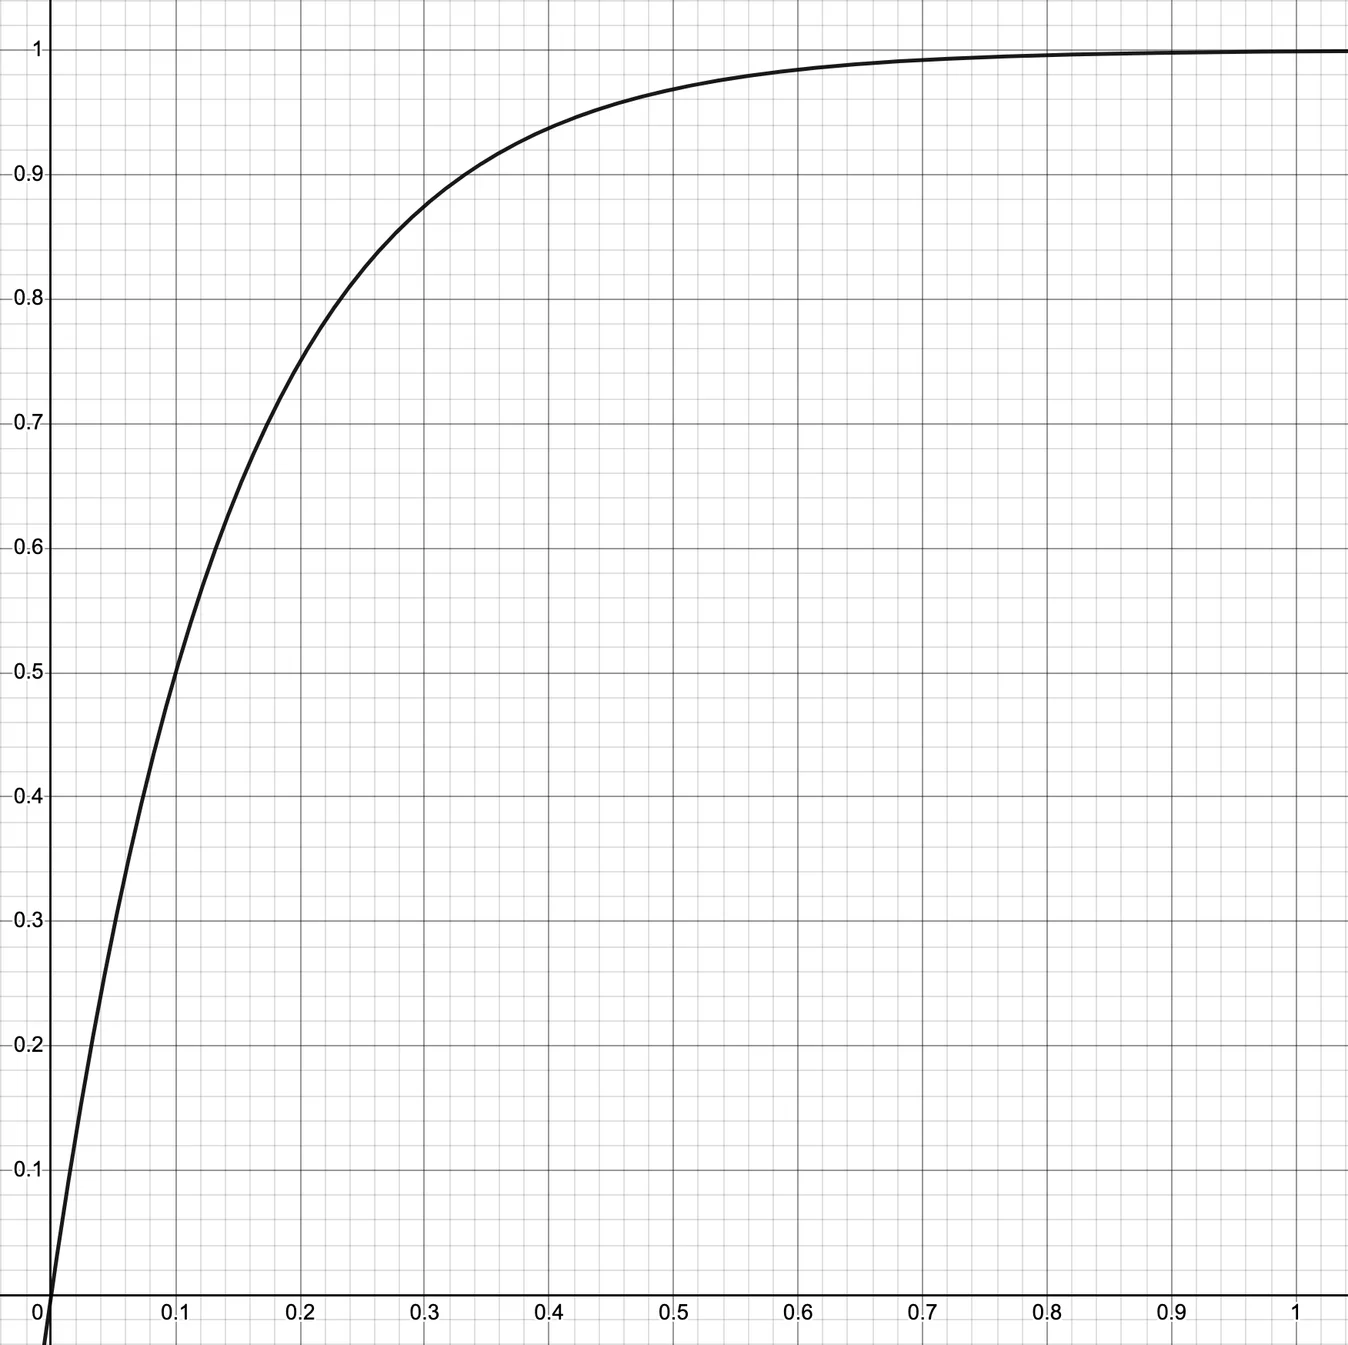
As we can see, starting from x = 0.5 there is very little variation left.
Here is how to create the corresponding PORTLAND color ramp:
import { ColorRampCollection } from "@maptiler/sdk";

const ramp = ColorRampCollection.PORTLAND.scale(300, 4000).resample("ease-out-exp");
The color ramp created looks very left-skewed:
And the map visualization:
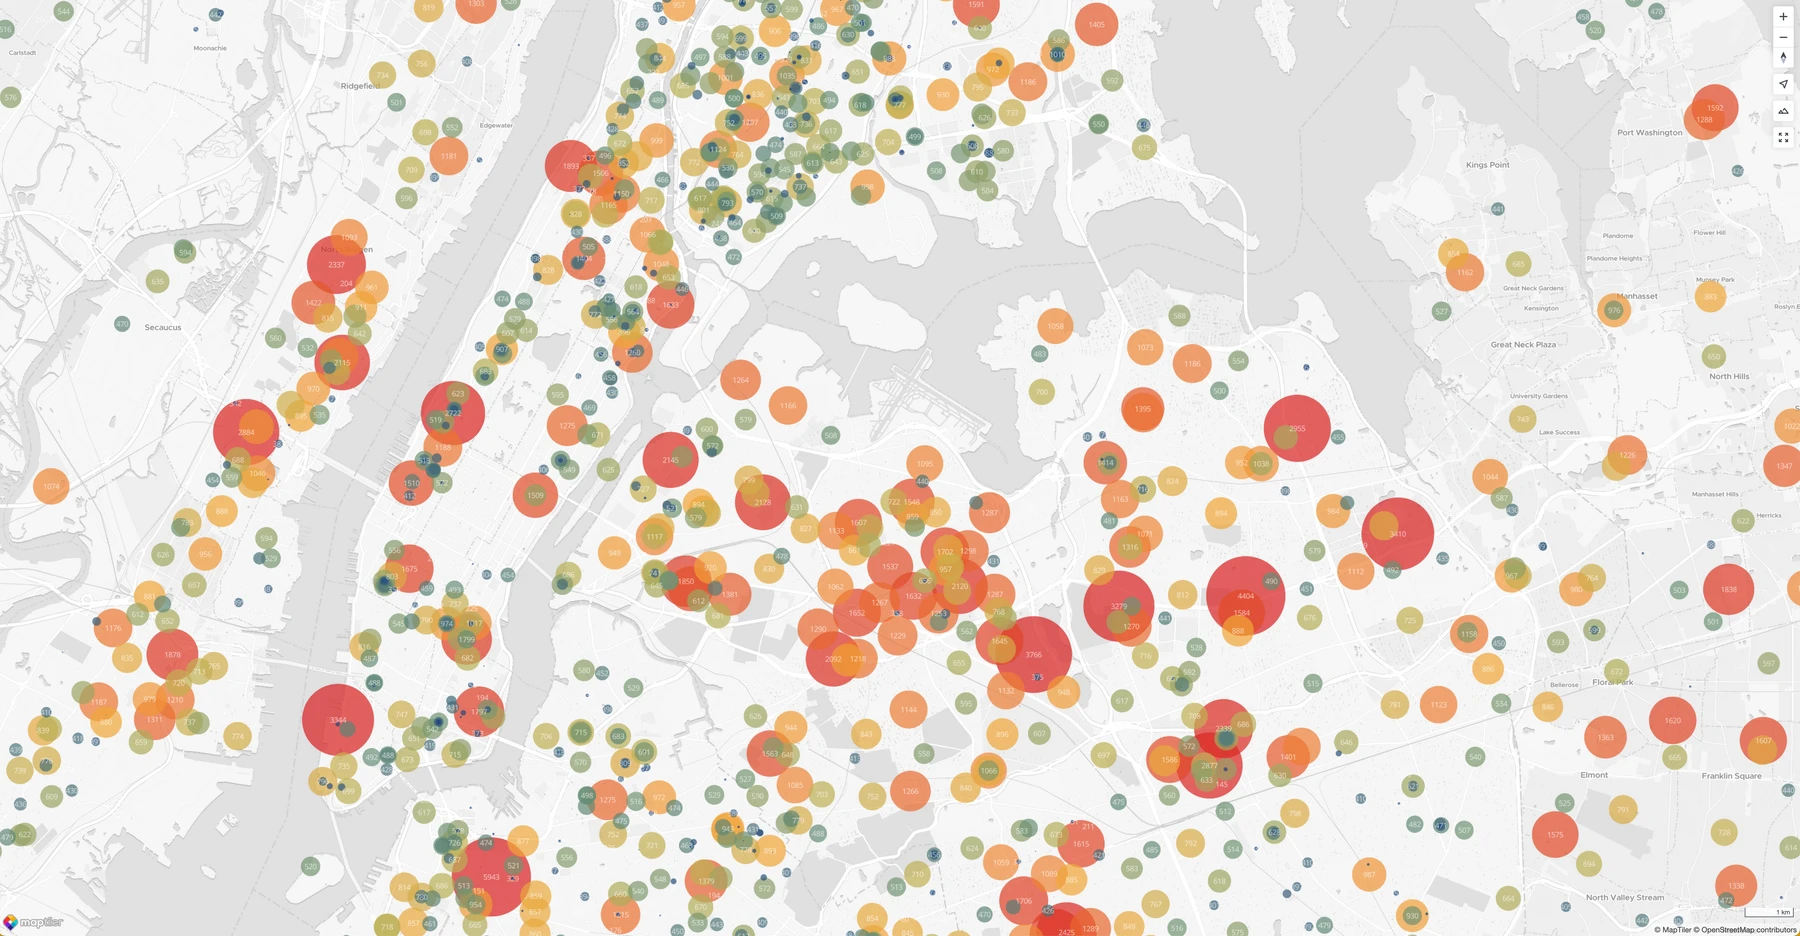
The South Bronx (north of Manhattan) contains many smaller schools that now look like they no longer have the blue color representative of the lower bound from the Portland color ramp. This means we crossed a line in terms of resampling functions, and this color ramp is no longer suitable for our purpose.
Of course, knowing that the granularity of the color ramp on the second half is poor, we can change its range, perhaps doubling it to [300, 8000]:
import { ColorRampCollection } from "@maptiler/sdk";

const ramp = ColorRampCollection.PORTLAND.scale(300, 8000).resample("ease-out-exp");
And we would still obtain a decent visualization:
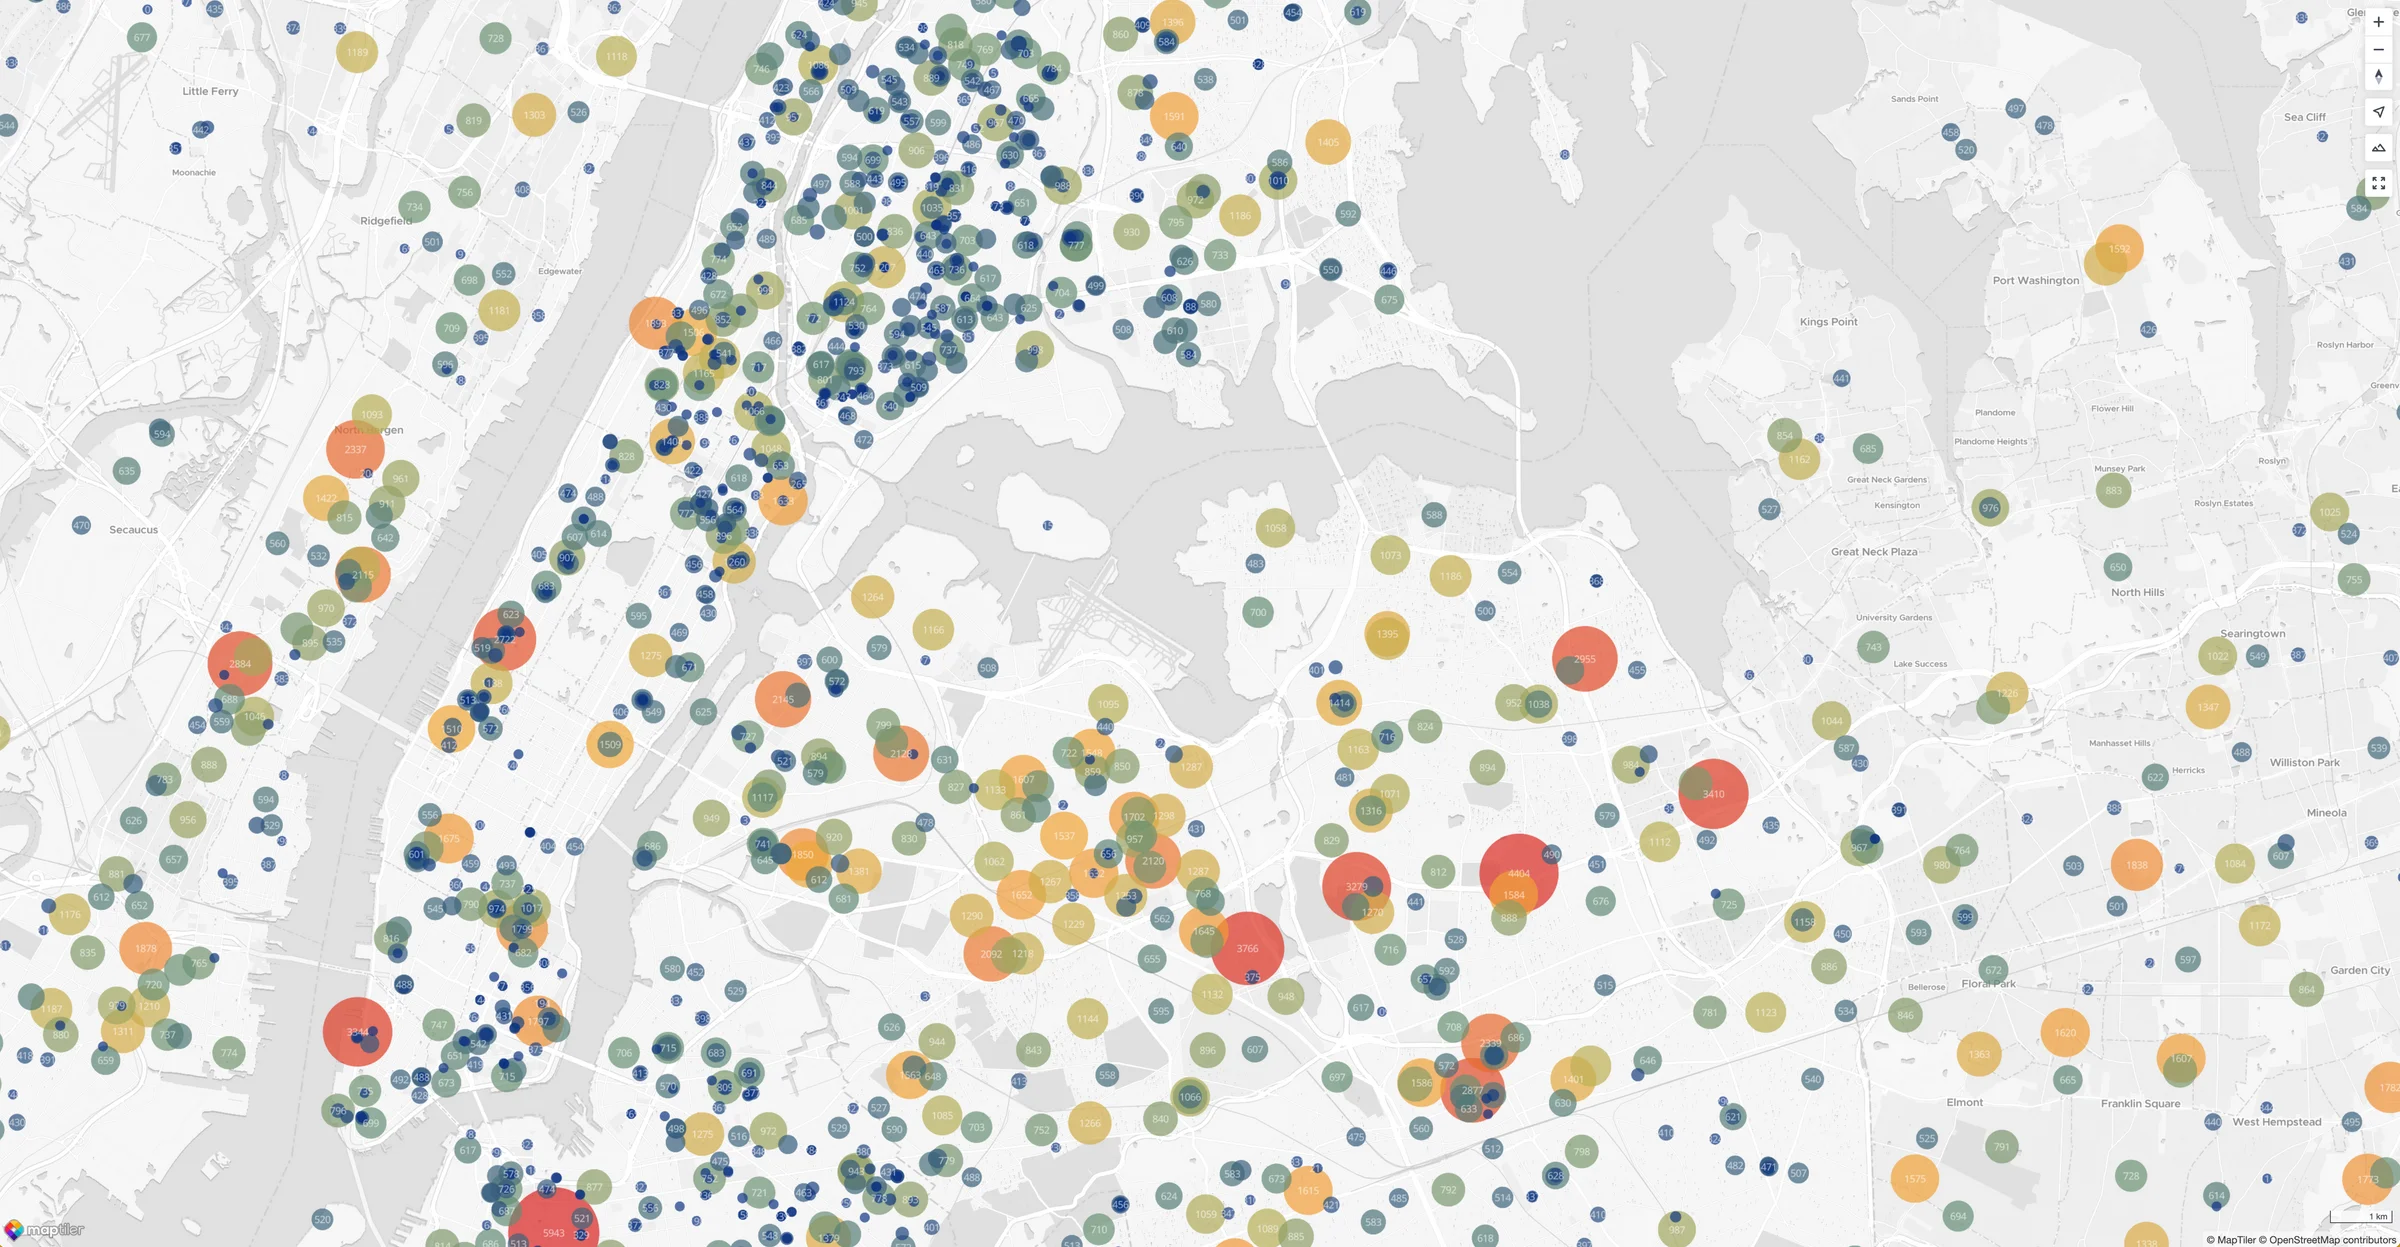
However, this approach is backward, as it adapts the data range to the limitations of the color ramp. This adds unnecessary complexity.
Tip
For this visualization, we recommend using Non-linear: ease-out square-root .resample("ease-out-sqrt").
Built-in color ramps
The SDK includes many built-in, ready-to-use color ramps as well as additional logic to manipulate them and create new ones. Here is the full list: